Drinking? The science of the buzz and how you can control it
The science of drinking: How to make it work better for you
If you choose to drink alcohol, you’re likely familiar with the relaxed, chatty buzz that may come early in the evening—and the slump that sometimes follows (the tiredness, the nausea, maybe the fear of what you posted online). If you’re drinking in school, you can learn how to get that buzz without the slump. For those who drink alcohol, this skill is key to a night—no, a lifetime—of positive experiences and few, if any, regrets.
What makes alcohol tricky to navigate? First, we need to understand how alcohol affects us—which in certain key respects is different from popular myth. With those basic concepts, we can choose to drink alcohol in ways that give us what we want from it.
Second, we all like to believe that we make our own choices, and to some extent, we do. But it’s complicated. A ton of research shows that our behavior, including what we drink, is highly dependent on what’s happening around us. In college, getting the alcohol buzz without the slump means grappling smartly with social dynamics, in addition to understanding the science of how alcohol affects us. This is especially relevant when you’re new to college, new to drinking, or both. (The minimum legal age for consuming alcohol in the US is 21.)

Why some alcohol can feel fun—and more alcohol doesn’t
Getting a buzz on
If you choose to drink alcohol, it may help you relax, socialize, and have fun—up to a point. Depending on what you drink, how much you drink, and how quickly or slowly you drink it, the alcohol level in your blood will rise to a certain level—let’s call it “peak buzz.”
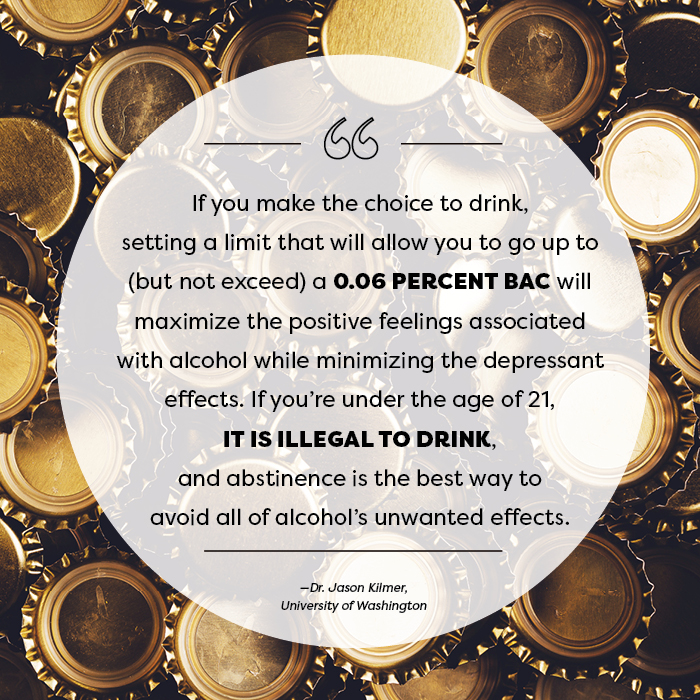
For most people of average tolerance, peak buzz happens when your Blood Alcohol Content (BAC)—the concentration of alcohol in your bloodstream—approaches 0.06 percent. For most people, two to three drinks within an hour will have this effect. Some research indicates that 0.06 percent BAC is on the high side; you may find peak buzz comes at any point after 0.04 BAC.
After the buzz, the slump
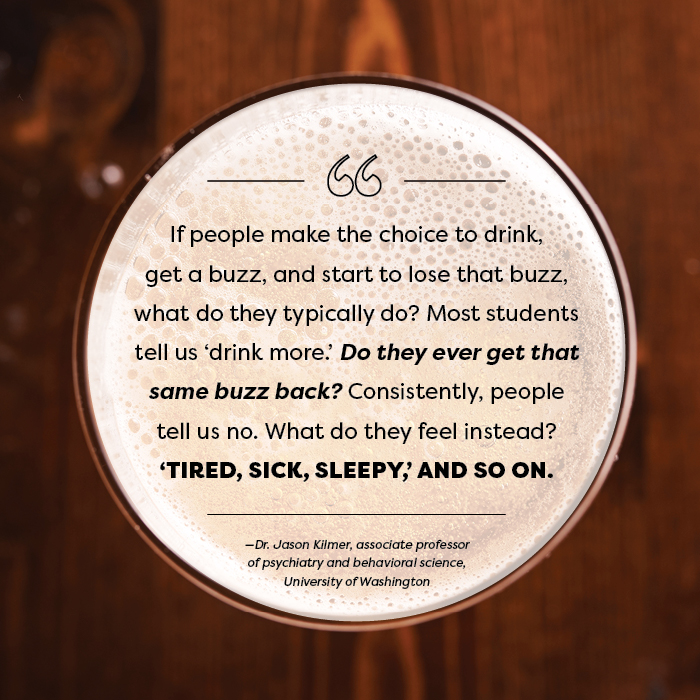
Beyond that point—0.06 percent BAC—the enjoyable effects of alcohol decline and wear off. You may feel sleepy, flat, disconnected. You may get moody or sick, or make unwise decisions. From here, there’s no going back to peak buzz. Drinking more alcohol can only take you deeper into the slump and toward regret territory.
The science of the slump—and why you can’t get the buzz back
Explained by Dr. Jason Kilmer, associate professor of psychiatry and behavioral science, University of Washington:
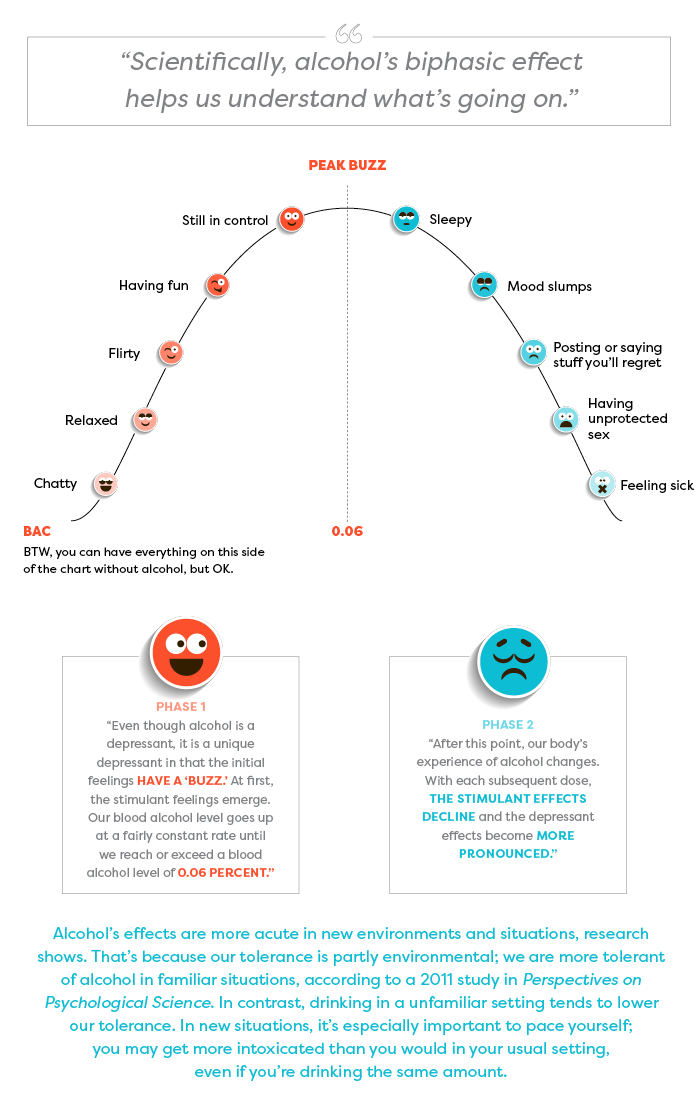
“The biphasic aspect actually occurs within the brain. The brain center that inhibits our actions is the first to be affected (depressed) by alcohol. So without the inhibiting center the other areas somewhat go wild, and we feel uninhibited, etc. Later, the brain functions that allow us to act bolder and less shy also get depressed, and then we slump.” —Dr. Pierre-Paul Tellier, director of student health services at McGill University, Quebec
These buzz effects and slump effects in the chart are examples of how people may experience alcohol; the sequence of effects on each side of the chart is in no particular order.
The key to getting what you want from alcohol
Three questions to match your alcohol intake with peak buzz
What do I drink?
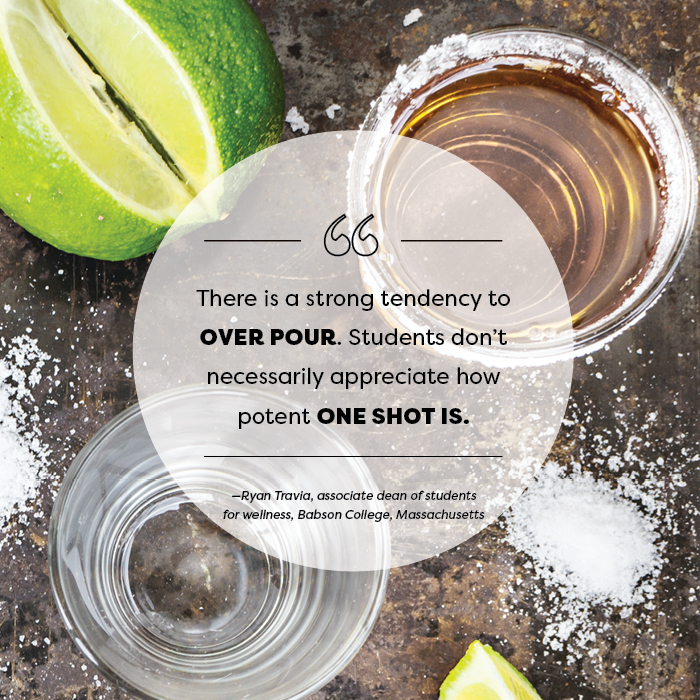
The amount of alcohol you consume depends partly on what you’re drinking. Alcoholic beverages vary enormously in their alcohol content.
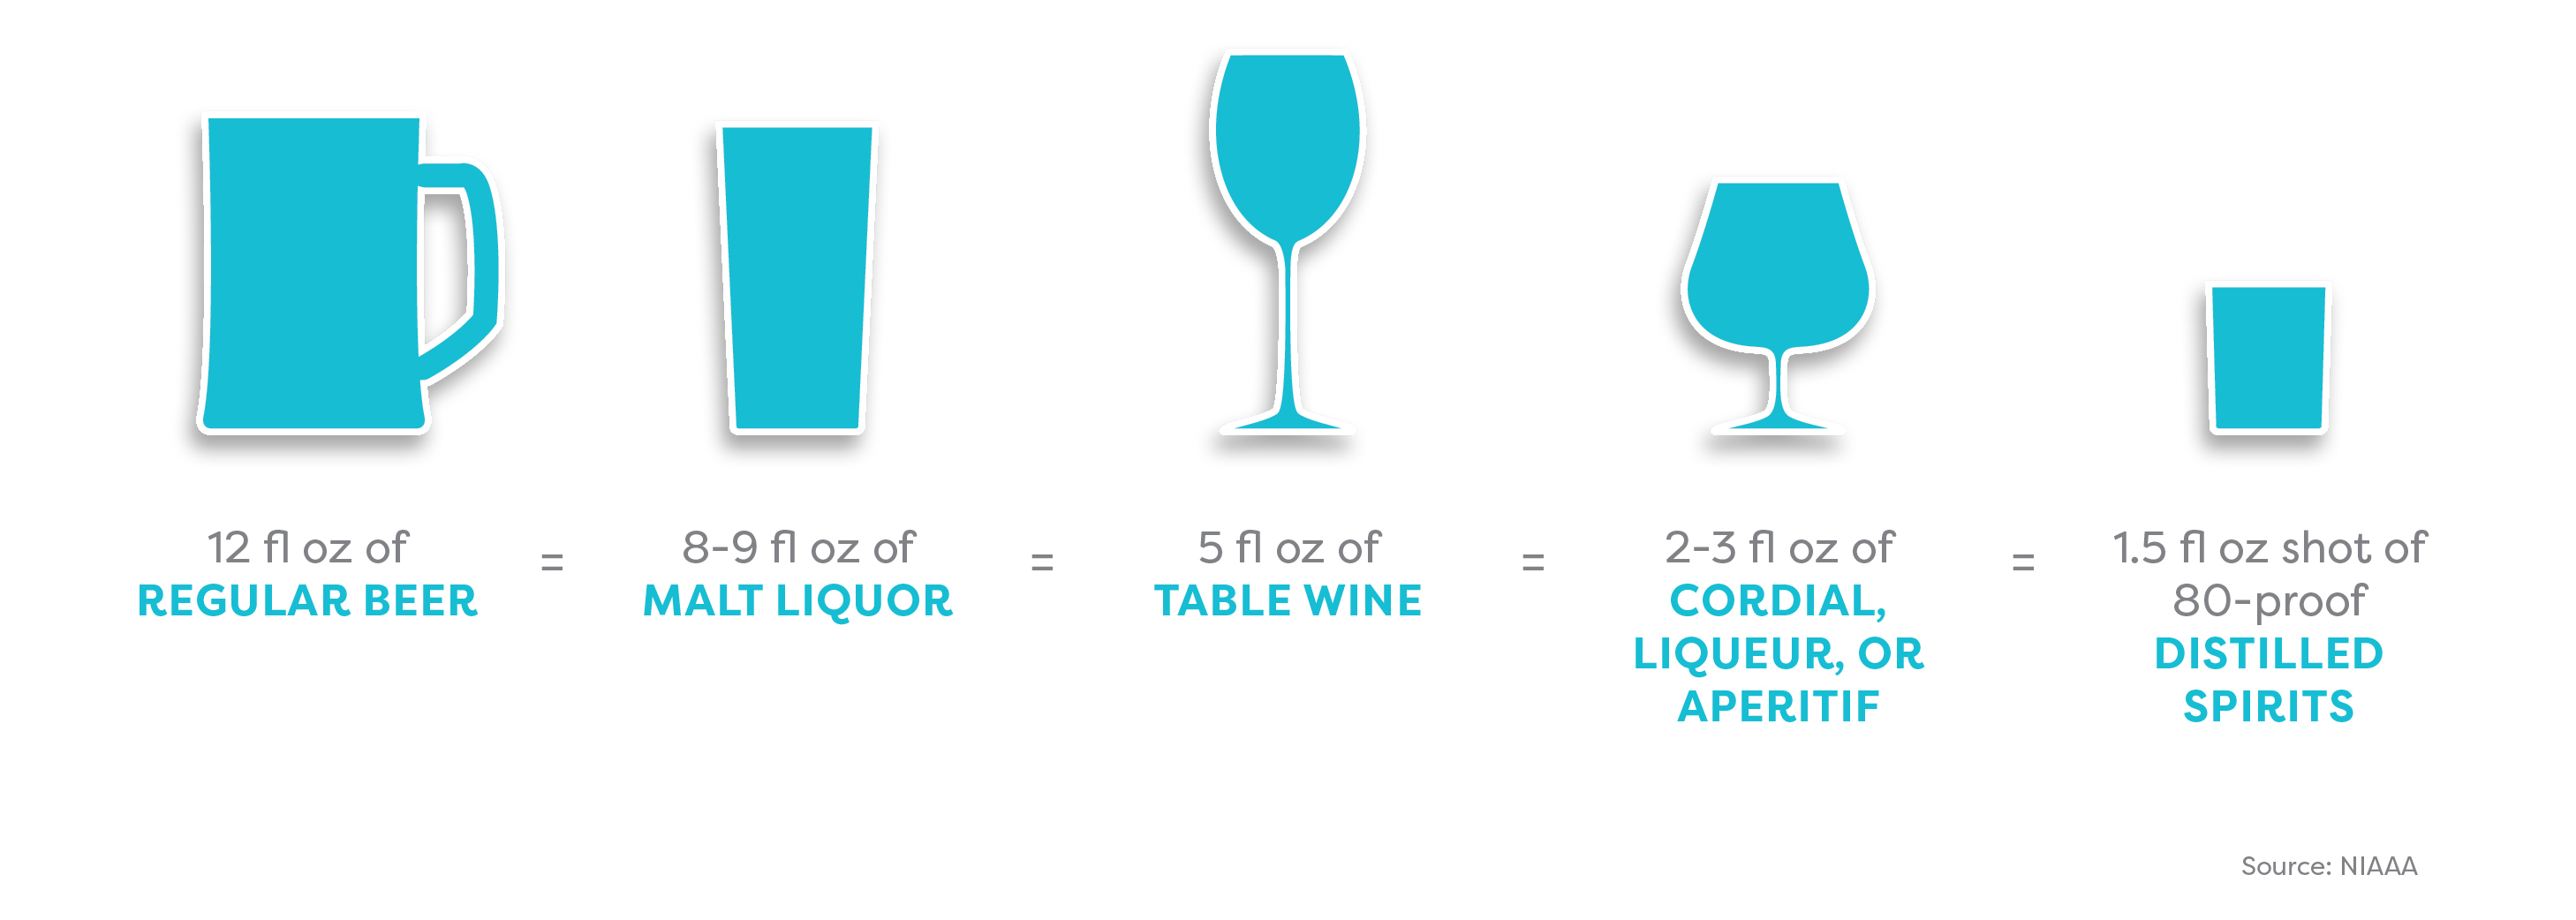
What’s my usual serving size?
The amount of alcohol you consume also depends on the shape and size of your glass or cup. A standard serving size is unlikely to be whatever your new friend just ladled into that solo cup.
How to get the hang of serving sizes:
- Take bartending classes: Many campuses and community organizations offer classes in bartending and safe serving practices—often for free.
- Practice measuring and pouring, so you know what 5 oz. wine (for example) looks like in a red solo cup. Remember:
- Red solo cups come in different sizes.
- The lines on red solo cups are not reliable measures of serving size.
Try this size calculator (NIAAA)
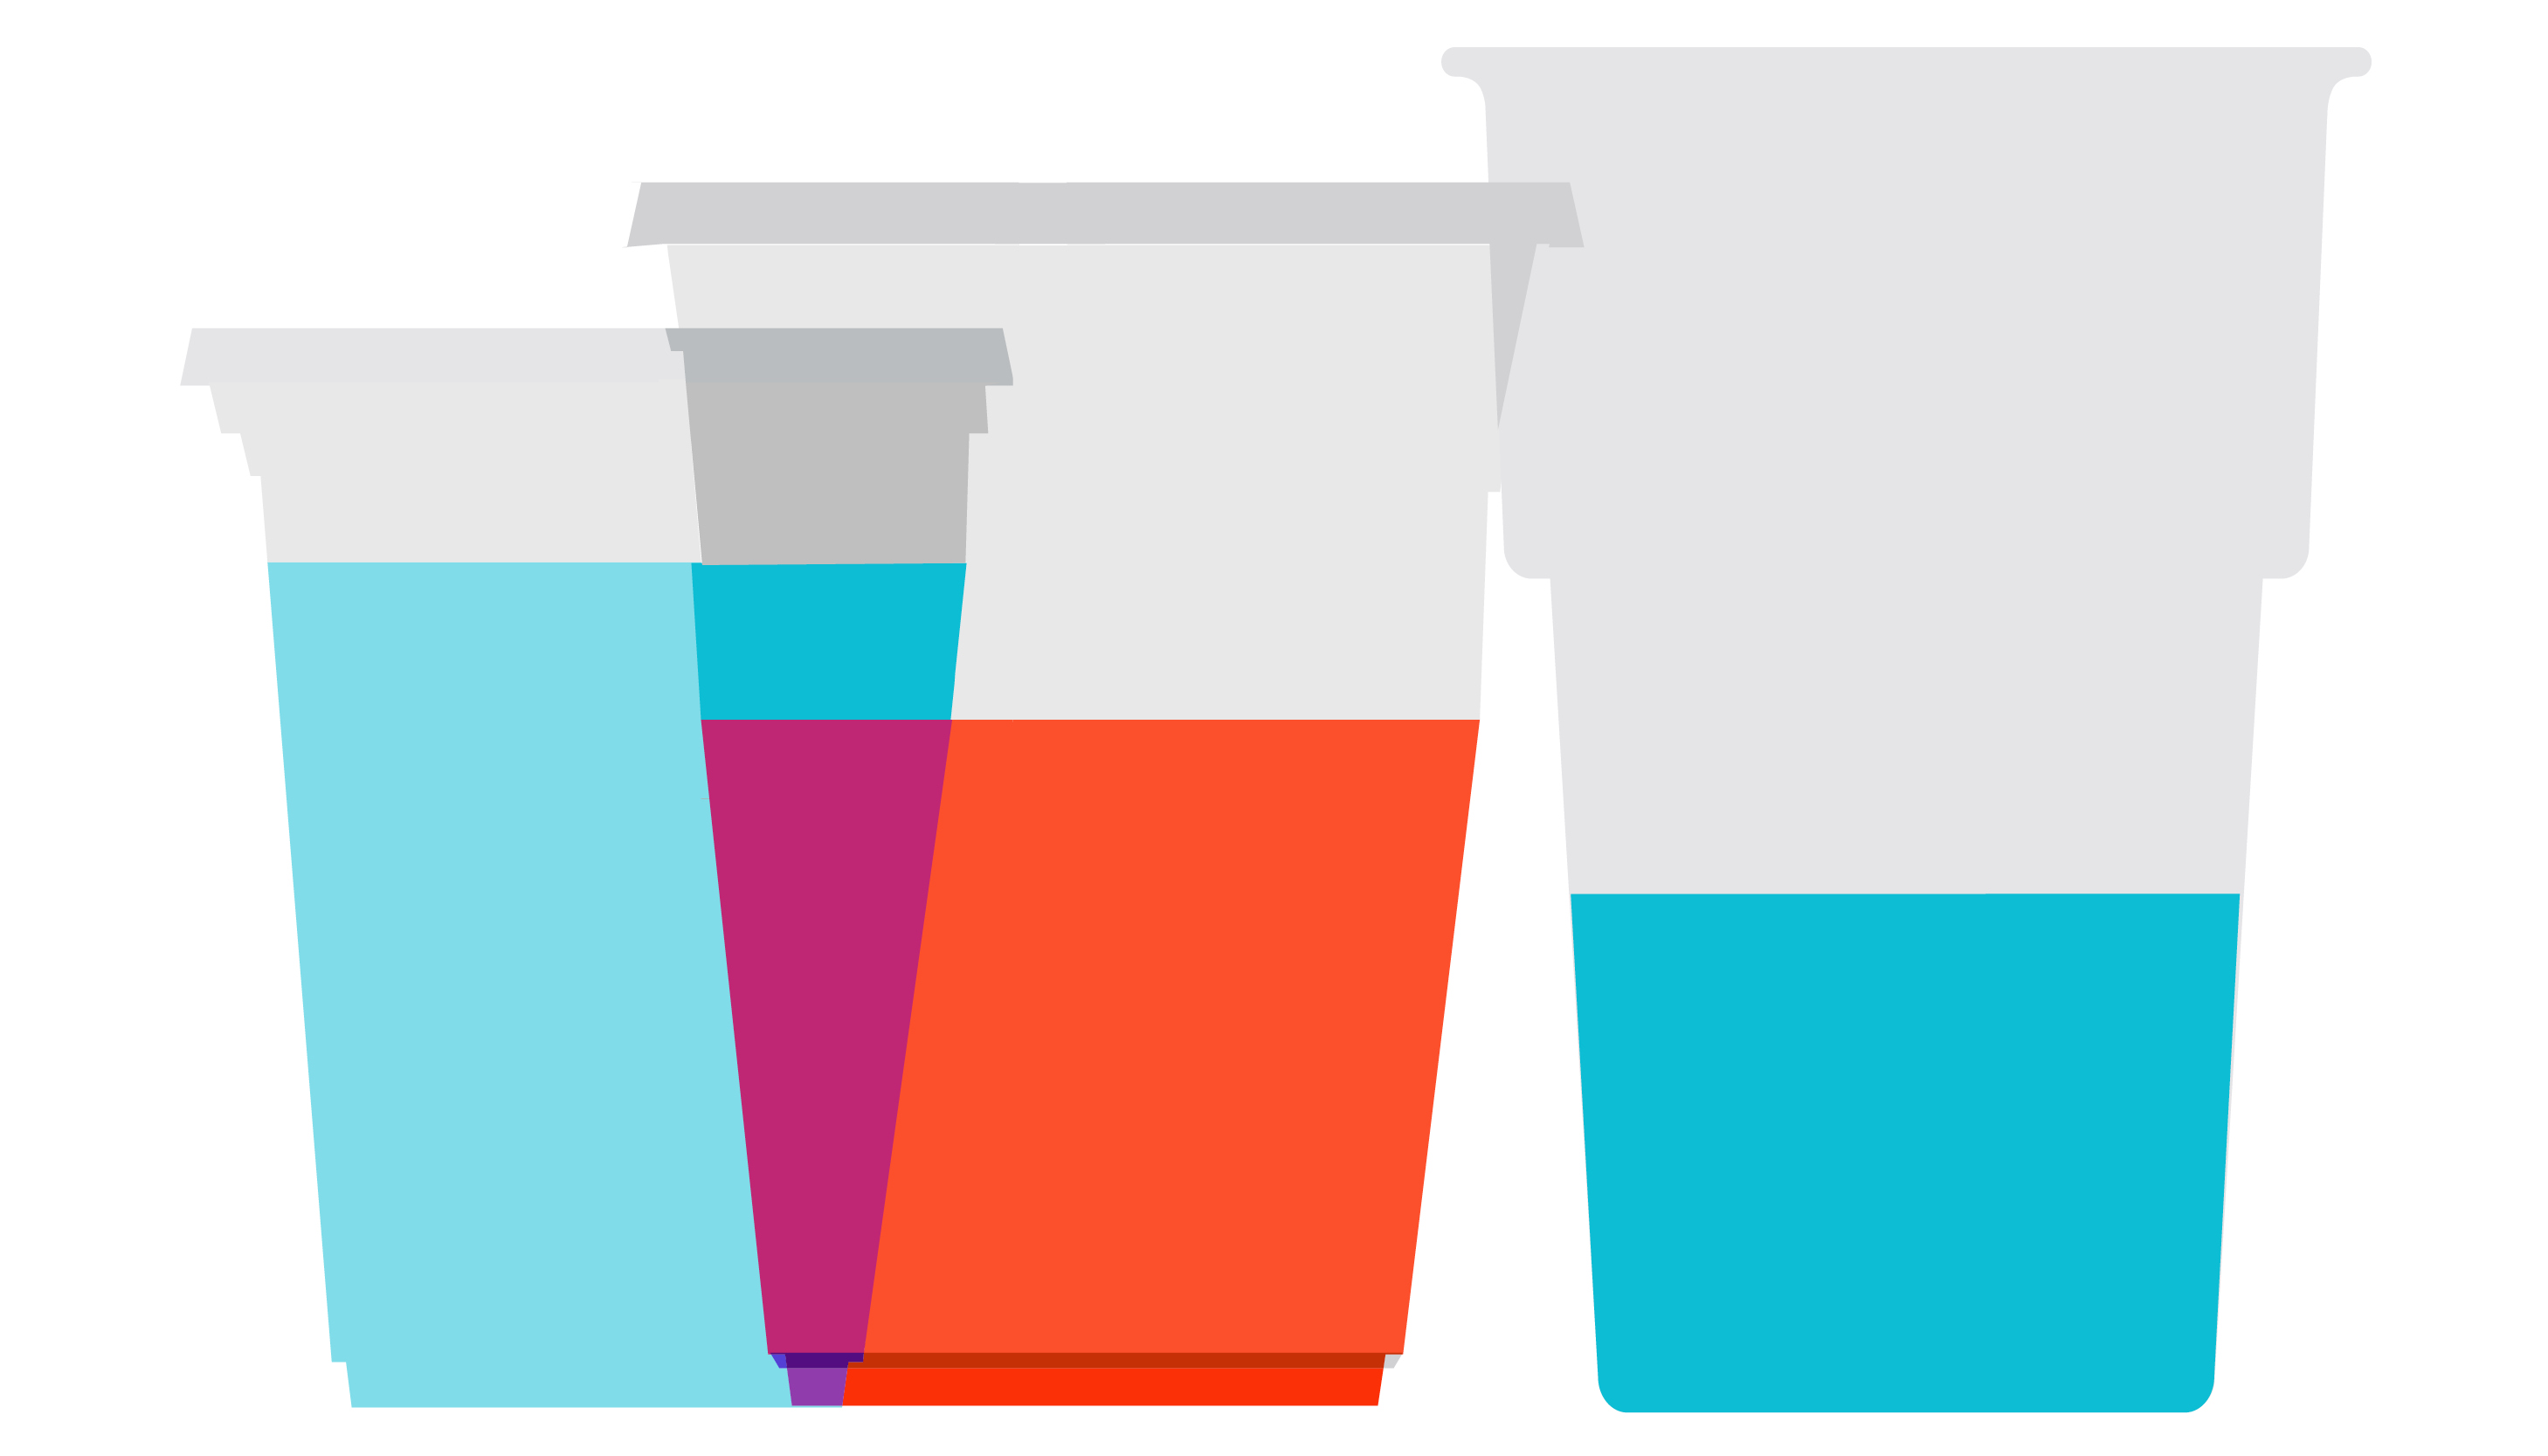
The same size beverage can look very different depending on the size and shape of the cup or glass.
How long will I be out for?
Think about pacing your drinking. Most people take about one hour to metabolize one standard drink. If you’ll be out for, say, four hours, and you plan to have three alcoholic drinks, you may decide to have one alcoholic drink per hour for the first three hours.
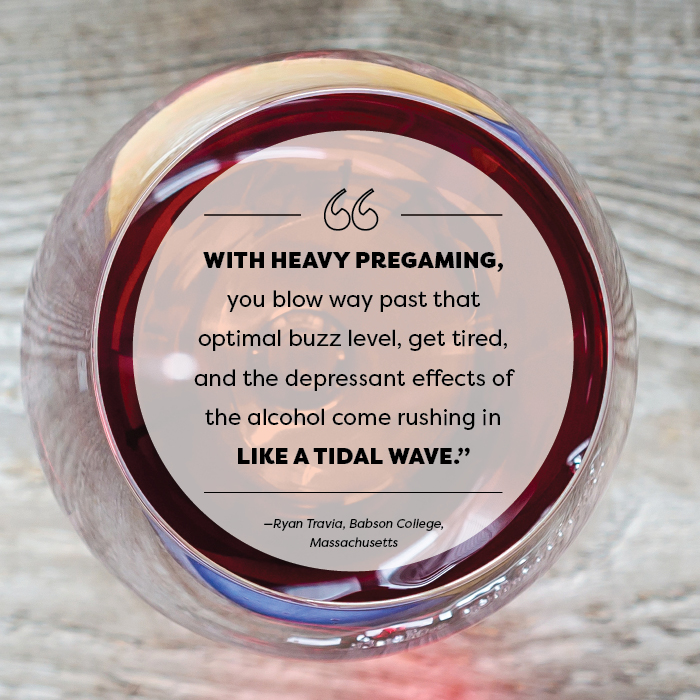
Pregaming—drinking before you go out—means you hit peak buzz earlier. If you keep drinking, your mood declines earlier too.
How to estimate your Blood Alcohol Content
BAC calculators and charts help you estimate the number of standard drinks you can consume before your BAC reaches peak buzz (0.06 percent).
Example:
Woman (155 lb, 5’7″): 3 standard drinks in 3 hours
Man (155 lb, 5’7″): 3 ½ standard drinks in 3 hours
Check out this BAC chart (Yale University)
Or this one (Cleveland Clinic)
BAC charts and calculators are useful but limited tools:
- They estimate how much alcohol someone of your body type and sex can typically drink before experiencing certain effects (positive and negative).
-
They do not account for various other factors that may influence your alcohol tolerance (e.g., age, health, fatigue, medications, food consumed, and whether or not the environment is familiar).
-
You may need to adjust the BAC percentage to account for the amount of time you’re drinking.
Effective tools and tips for having fun and staying in control
Rethinking Drinking (info, tools, etc.): National Institute on Alcohol Abuse and Alcoholism (NIAAA)
Handle your urge to drink and friends who offer: NIAAA
Calculators for alcohol content, calories, cost, etc.: NIAAA
Guides to the social dynamics around drinking alcohol: BestCollegeReviews.org
Stopping at the buzz: GoodTherapy.org
Best alcohol apps of 2016: Healthline.com
Article sources
Jason Kilmer, PhD, associate professor of psychiatry and behavioral science, University of Washington; assistant director of health and wellness for alcohol and other drug education, Division of Student Life, University of Washington.
Joan Masters, MEd, senior coordinator, Partners in Prevention, University of Missouri Wellness Resource Center; area consultant, The BACCHUS Network.
Ann Quinn-Zobeck, PhD, former senior director of BACCHUS initiatives and training, NASPA - Student Affairs Professionals in Higher Education (peer education initiatives addressing collegiate health issues at US colleges).
Pierre-Paul Tellier, MD, director of student health services, McGill University, Quebec.
Ryan Travia, MEd, associate dean of students for wellness, Babson College, Massachusetts; founding director, Office of Alcohol & Other Drug Services (AODS), Harvard University.
American College Health Association. American College Health Association–National College Health Assessment II: Reference Group Undergraduates Executive Summary Fall 2015. Hanover, MD: American College Health Association; 2016.
Borsari, B., & Carey, K. B. (2001). Peer influences on college drinking: A review of the research. Journal of Substance Abuse, 13, 391–424. Retrieved from https://citeseerx.ist.psu.edu/viewdoc/download?doi=10.1.1.602.7429&rep=rep1&type=pdf
Borsari, B., & Carey, K. B. (2006). How the quality of peer relationships influences students’ alcohol use. Drug and Alcohol Review, 25(4), 361–370.
Crawford, L. A., & Novak, K. B. (2007). Resisting peer pressure: Characteristics associated with other-self discrepancies in college students’ levels of alcohol consumption. Journal of Alcohol and Drug Education, 51(1), 35–62.
Harrington, N. G. (1997). Strategies used by college students to persuade peers to drink. Southern Communication Journal, 62(3), 229–242. Retrieved from https://www.tandfonline.com/doi/abs/10.1080/10417949709373057?journalCode=rsjc20
Kilmer, J., Cronce, J. M., & Logan, D. E. (2014). “Seems I’m not alone at being alone:” Contributing factors and interventions for drinking games in the college setting. The American Journal of Drug and Alcohol Abuse, 40(5), 411–414.
Neighbors, C., Lee, C. M., Lewis, M. A., Fossos, N., & Larimer, M. E. (2007). Are social norms the best predictor of outcomes among heavy-drinking college students? Journal of Studies on Alcohol and Drugs, 68, 556–565.
Neighbors, C., Jensen, M., Tidwell, J., Walter, T., Fossos, N., & Lewis, M. A. (2011). Social-norms interventions for light and nondrinking students. Group Processes & Intergroup Relations, 14(5), 651-669. doi: 10.1177/1368430210398014
Palmeri, J. M. (2016). Peer pressure and alcohol use among college students. Applied Psychology Opus, NYU Steinhardt. Retrieved from https://steinhardt.nyu.edu/appsych/opus/issues/2011/fall/peer
Perkins, H. W., Linkenbach, J. W., Lewis, M. A., & Neighbors, C. (2010). Effectiveness of social norms media marketing in reducing drinking and driving: A statewide campaign. Addictive Behaviors, 35, 866–874.
Seigel, S. (2011). The four-loko effect. Perspectives on Psychological Science, 6(4), 357–362.
Student Health 101 survey, July 2016.
Turner, J., Perkins, H.W., & Bauerle, J. (2008). Declining negative consequences related to alcohol misuse among students exposed to social norms marketing intervention on a college campus. Journal of American College Health, 57, 85−93.
Wechsler, H., Nelson, T. E., Lee, J. E., Seibring, M., Lewis, C., & Keeling, R. P. (2003). Perception and reality: A national evaluation of social norms marketing interventions to reduce college students’ heavy alcohol use. Journal of Studies on Alcohol, 64, 484–494.


